Velocity Time Graph for Different Types of Acceleration
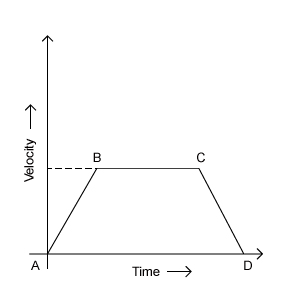
Motion is sometimes easier to interpret through graphical representation. The following graph represents three different types of acceleration:

Constant Positive Acceleration
During the interval between A and B, the velocity of the object increases at a constant rate. The slope of the graph is positive.
Constant Negative Acceleration
During the interval between C and D, the velocity of the object decreases at a constant rate. The slope of the graph is negative.
Zero Acceleration
During the interval between B and C, the velocity of the object does not change. The slope of the graph is zero.